LEK Integration
Logstash + ElasticSearch + Kibana => Log Analysization Platform
1. Log File
- We can download log tutorial from here: https://download.elastic.co/demos/logstash/gettingstarted/logstash-tutorial.log.gz
- Put logstash-tutorial file to destination directory
stevelee@SteveLee ‣ ~/Downloads ‣ cp ./logstash-tutorial.log /tmp
2. Configuring Logstash Service
- Create configuration file
stevelee@SteveLee ‣ ~/Develop/logstash-2.2.2 ‣ vi logstash-demo.conf
# The # character at the beginning of a line indicates a comment. Use
# comments to describe your configuration.
input {
file {
path => "/tmp/logstash-tutorial.log"
}
}
# The filter part of this file is commented out to indicate that it is
# optional.
# filter {
#
# }
output {
elasticsearch {
action => "index" #The operation on ES
index => "logstash-tutorial-es" #The index to write data to, can be any string.
}
}
3. Run Elasticsearch Service
stevelee@SteveLee ‣ ~/Develop/elasticsearch-2.2.0 ‣ ./bin/elasticsearch &
4. Run Logstash Service
stevelee@SteveLee ‣ ~/Develop/logstash-2.2.2 ‣ ./bin/logstash -f logstash-demo.conf
5. Check index created successfully or not
a.Check Elasticsearch console. If it shows information like below, created successfully.

6. Run Kibana Service
stevelee@SteveLee ‣ ~/Develop/kibana-4.4.1-darwin-x64 ‣ ./bin/kibana &
7. Kibana Dashboard
a. Visit http://127.0.0.1:5601.
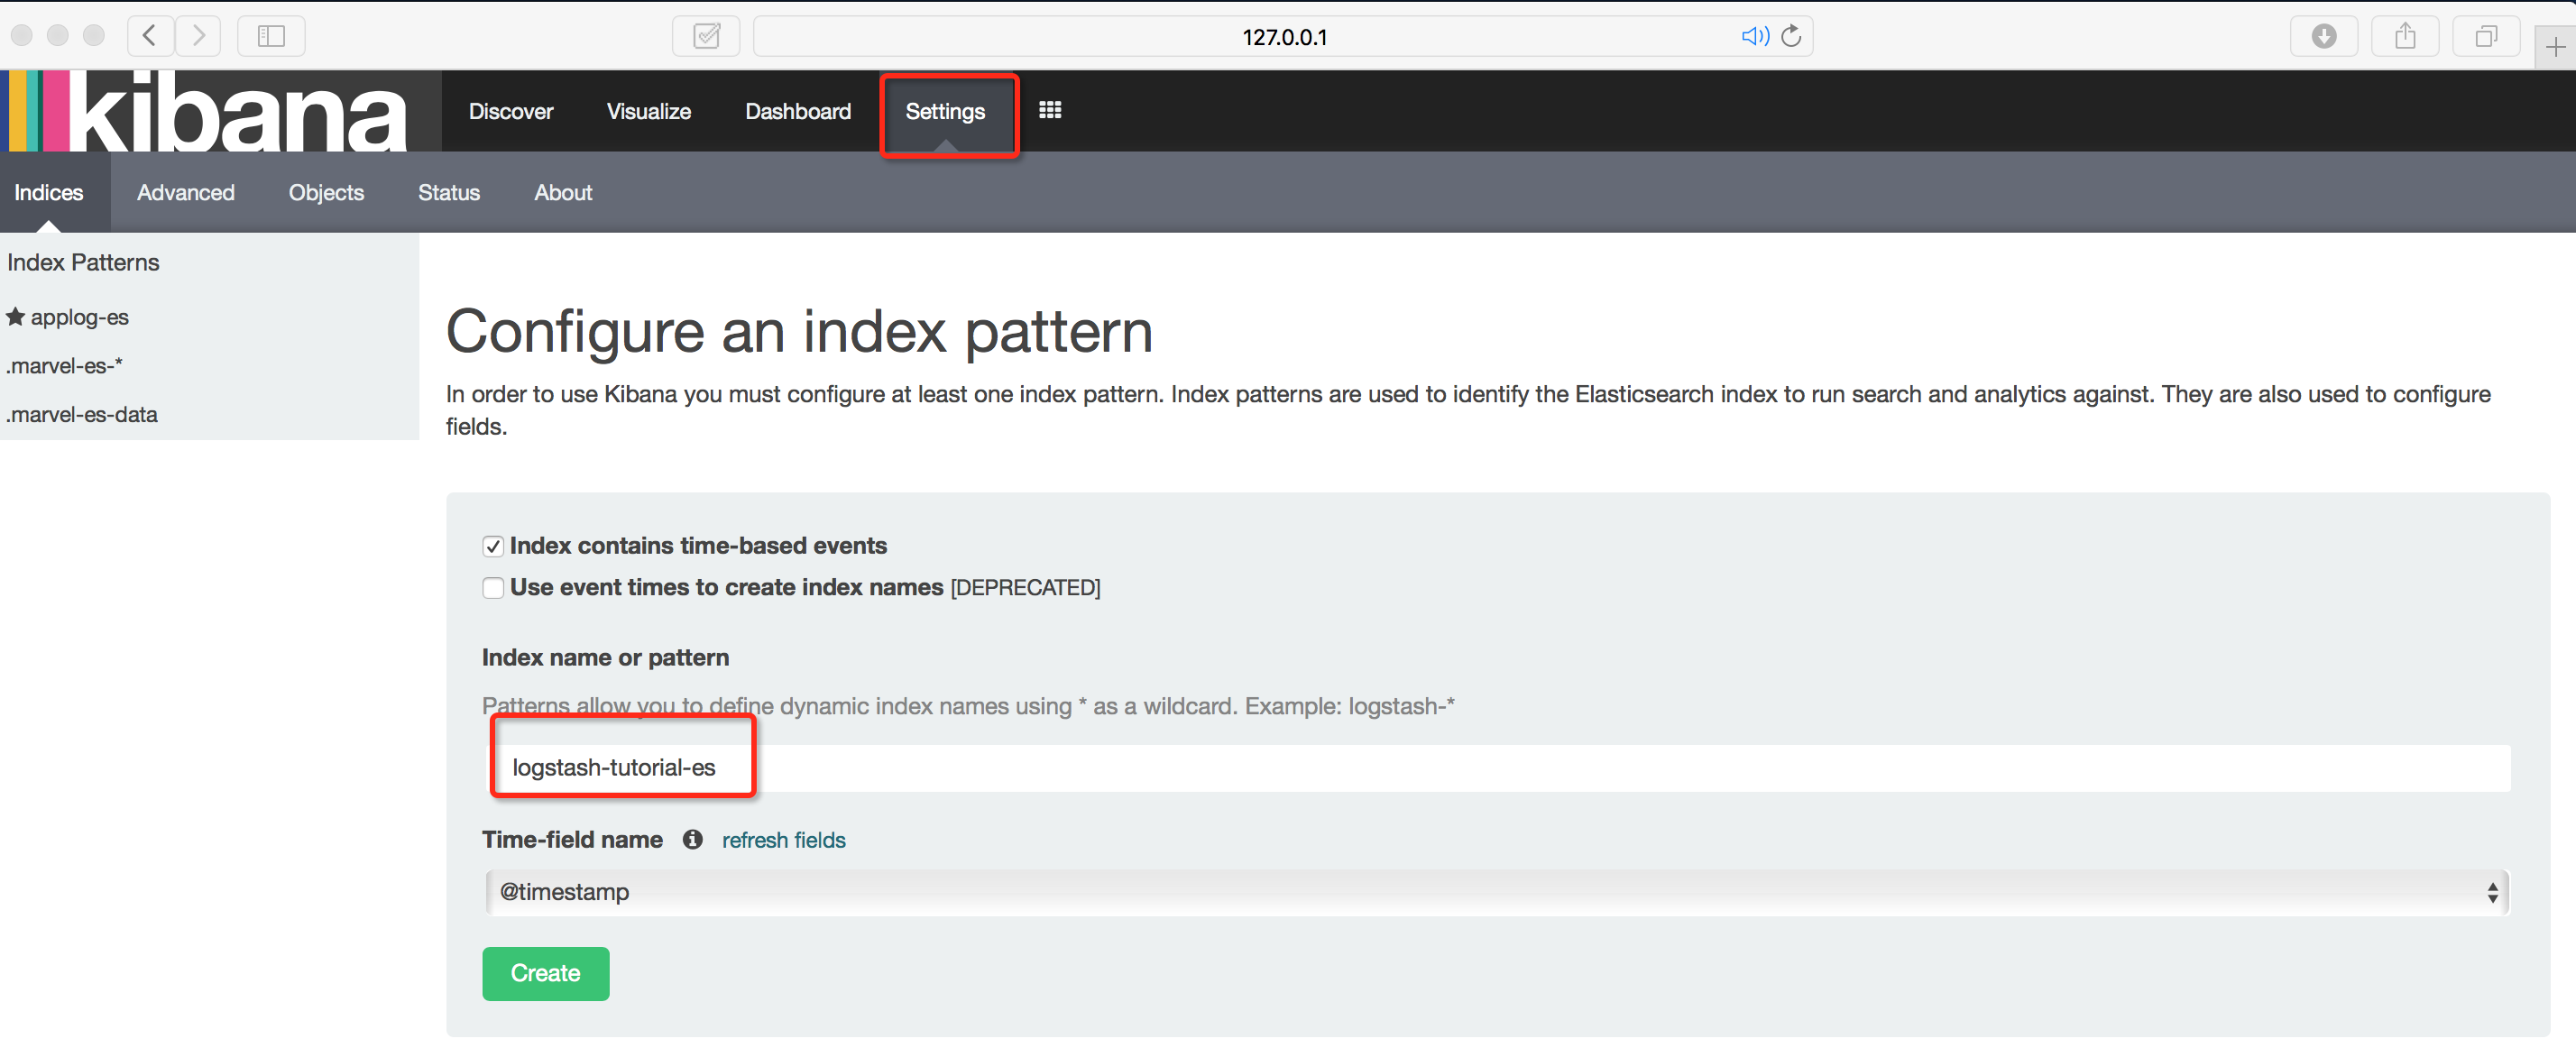
b. Select Setting, and key in index name (logstash-tutorial-es), then click create button.
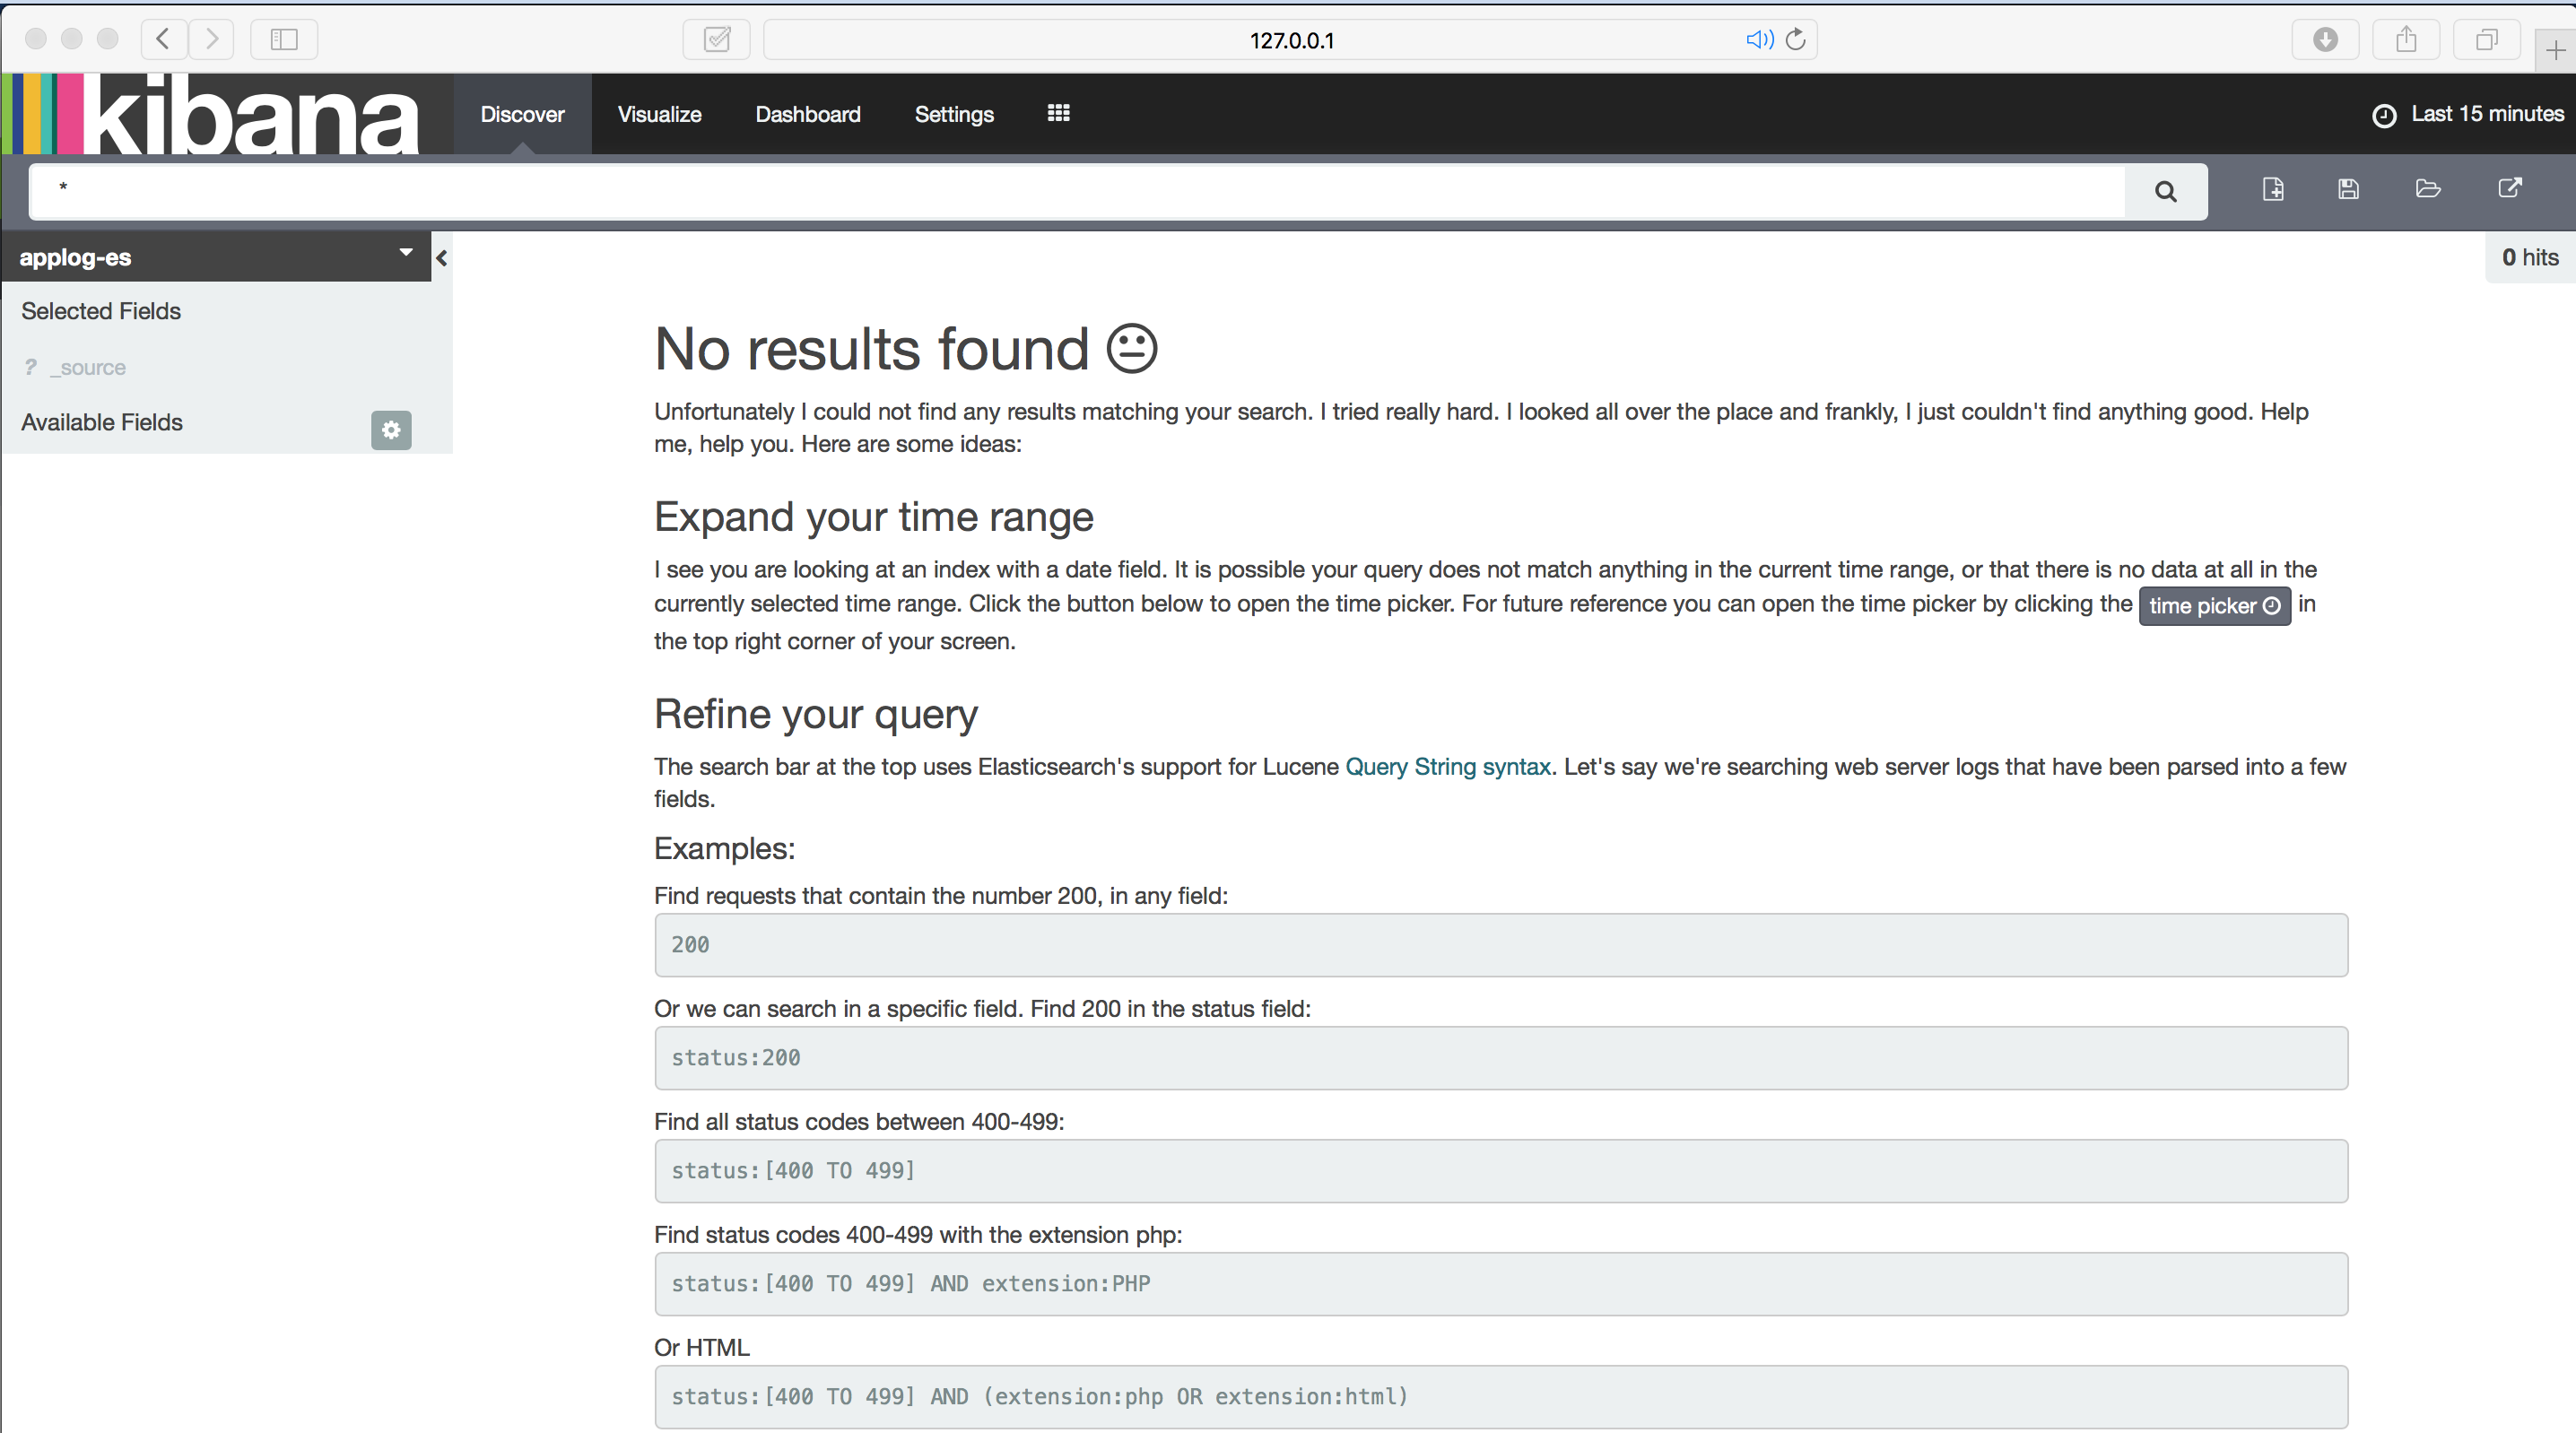
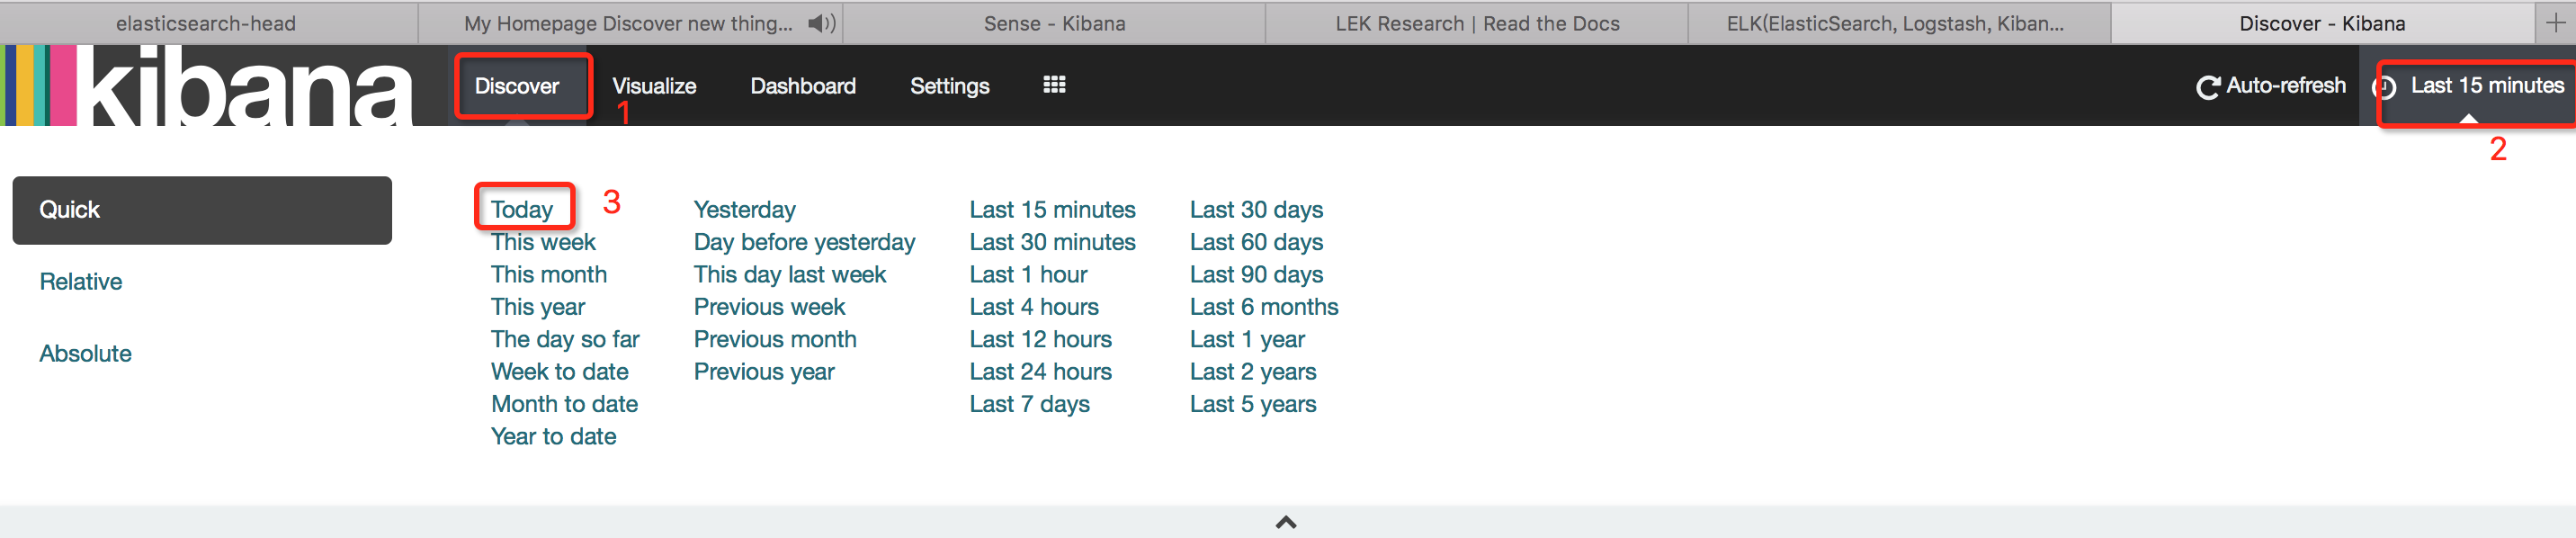
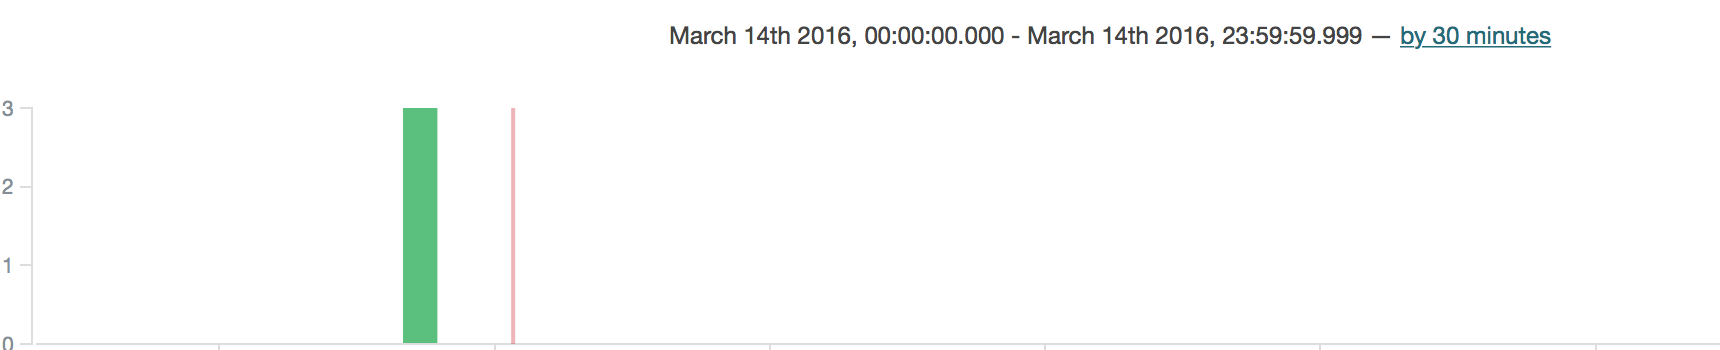
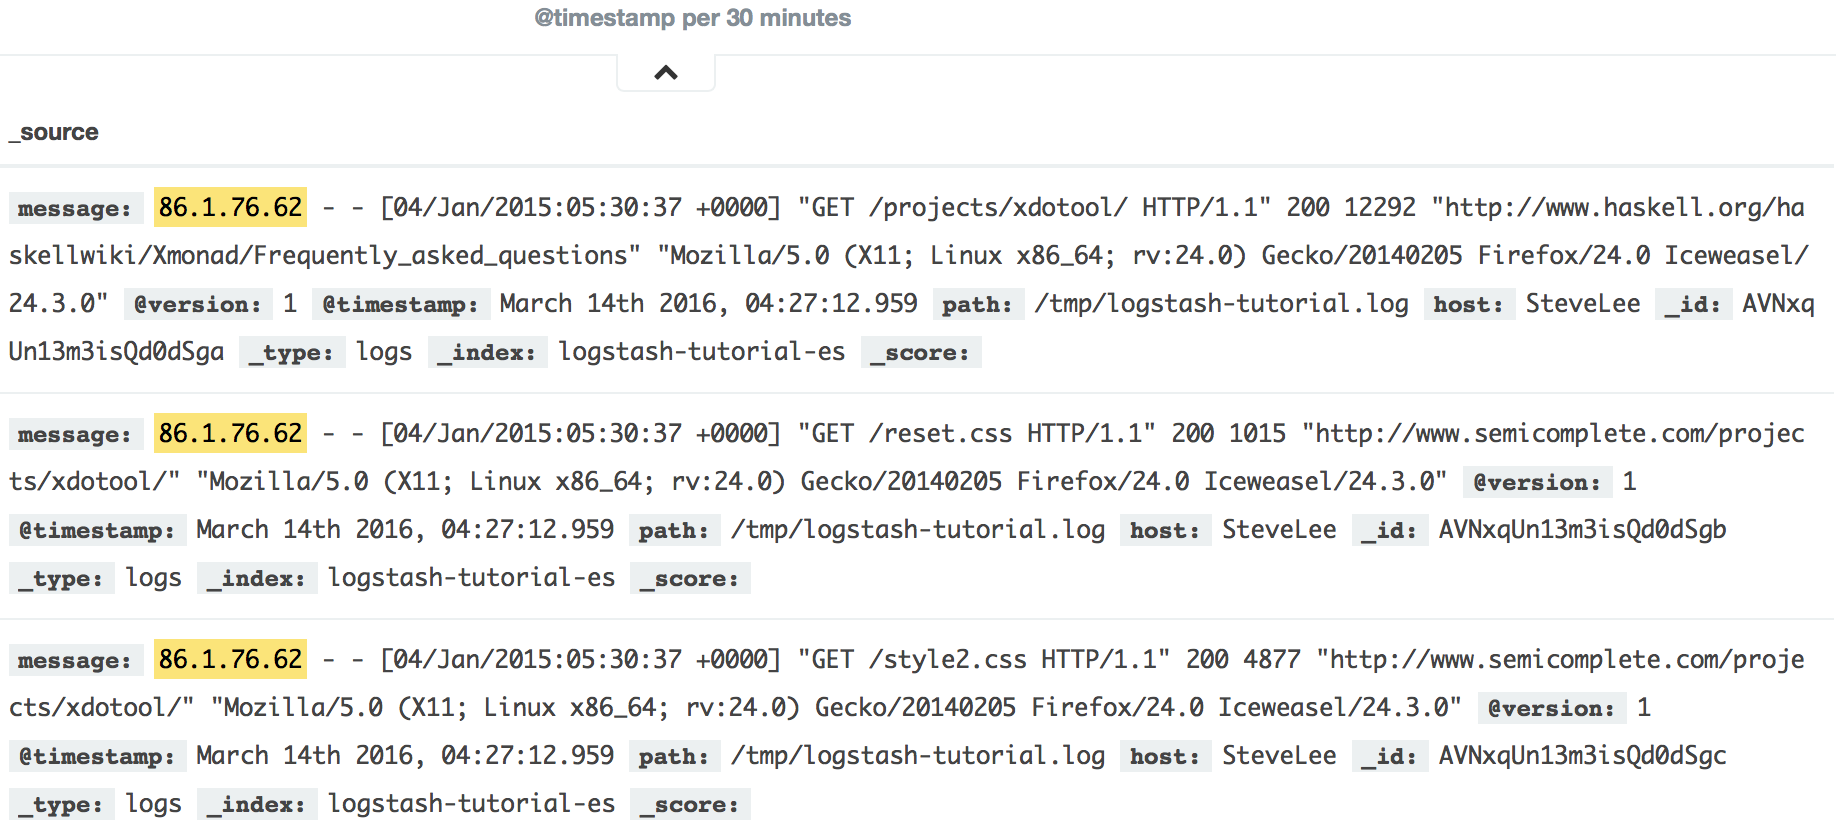
c. Select Discover, If shows “no results found”, need to follow below opeartion:
d. Filter, and save the result, name Result1

d. Select Visualize, and choose “Tile Map”, and choose “From a saved search(Result1), and Next:”
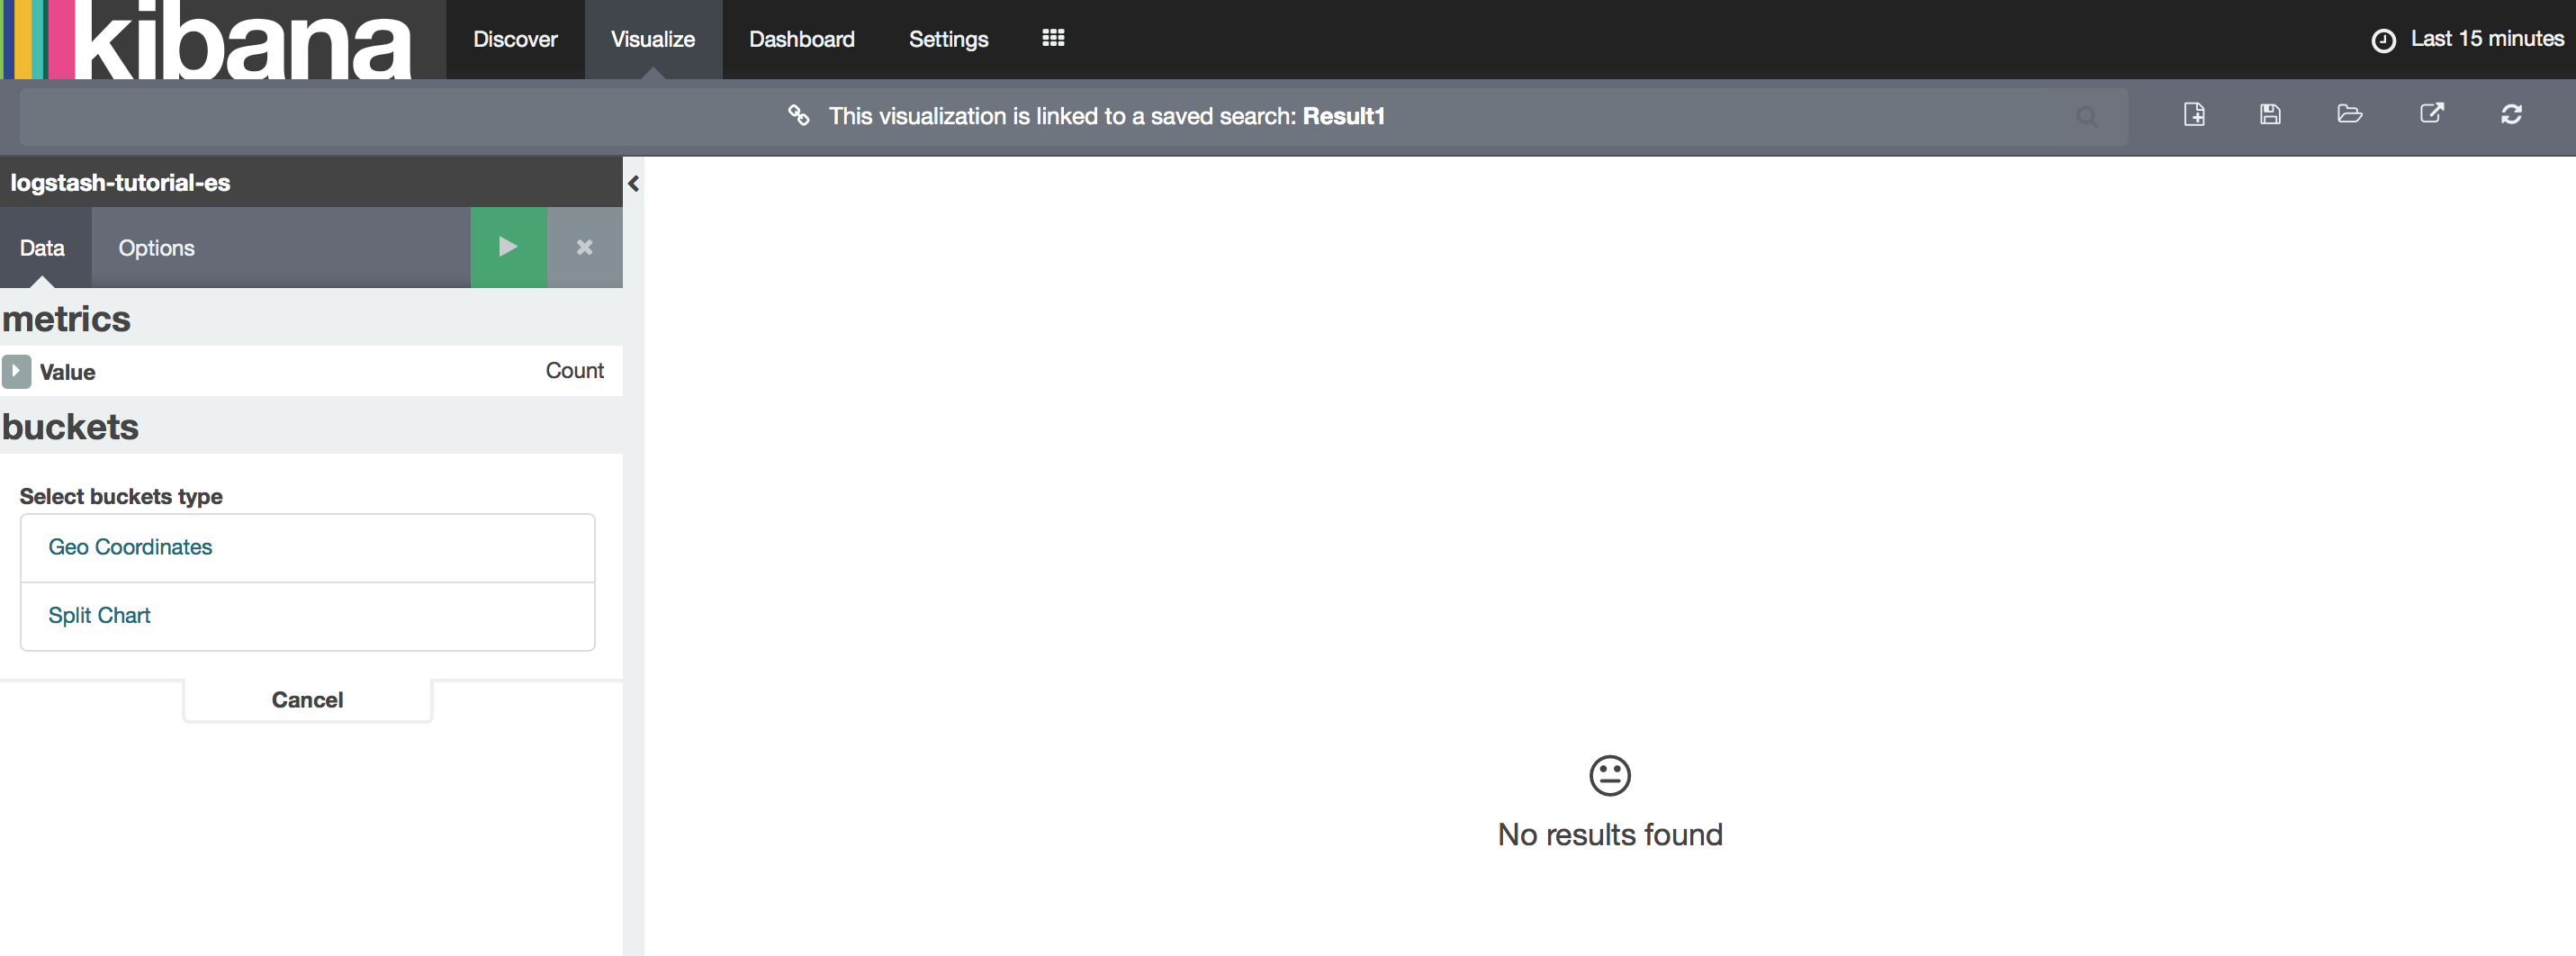
e. Saved visualzation result.
f. Select Dashboard.